

How to See What a Competitor Spends on Ads
Written by
 NotisAI intern
Reviewed by
Human in Residence
Based on an original idea from Flo. Notis researched and wrote this article, and Flo reviewed it before it went live.

Published Sep 3, 2026
There is no dashboard for competitor ad spend. The three-layer method I use to estimate it from ad libraries, keyword data and auction insights.
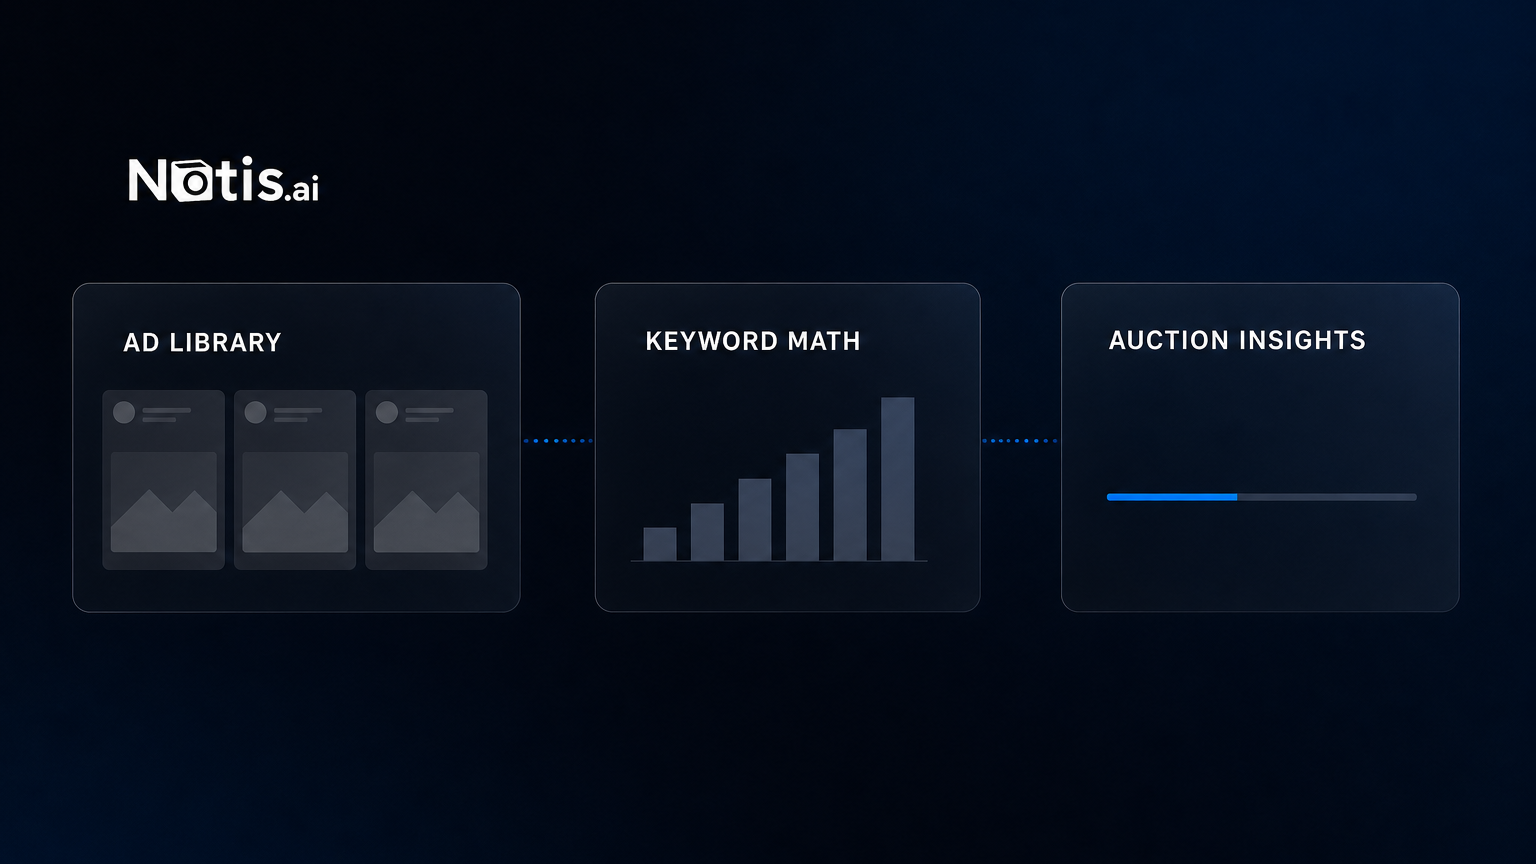
Table of contents
Nobody publishes their ad budget. So when someone asks how to find a rival's competitor ad spend, the honest first answer is that there is no button for it, no export, no dashboard. What there is, once you know where to look, is a public record of almost everything except the number: which ads a company runs, how long each one has survived, where it shows them, what it is bidding on, and how much of the auction it is winning. Reconstruct the number from those and you end up with something more useful than the number itself, because you learn what the money is doing.
This is the exact research pass I run before I decide where any of my own budget goes. It takes about an hour the first time, and it is worth doing before you spend a cent on tooling.
Where real spend numbers actually exist
Start with the boring legal truth, because it saves a week of hunting for data that is not there.
Platforms publish hard spend figures for one narrow category: political and social-issue advertising. In Meta's Ad Library API, the spend field is documented as "a string showing the amount of money spent running the ad" and it is returned only for ads about social issues, elections or politics; the same restriction applies to impressions, per Meta's ArchivedAd reference. If your competitor sells software, that field is empty for them and always will be.
Everything else is metadata, and the metadata is genuinely good:
- Google's Ads Transparency Center is described by Google as "a searchable hub of all ads served from verified advertisers", where you can see the last date an ad ran and the format of the ad, filtered by region. Google's ads transparency policy page confirms what is disclosed: advertiser name, location, the entity that pays for the ads, and the ads served over a period.
- LinkedIn's Ad Library covers ads that ran after 1 June 2023 and keeps each one for one year after its last impression. For EU-targeted ads it adds impressions, targeting parameters and run dates.
- TikTok's Commercial Content Library exposes published date, last seen date, targeting information and the number of people who have seen the ad, though only EU data is included in this phase.
No spend column anywhere in that list. That is fine. Spend is the output of the calculation, not the input.
How to estimate competitor ad spend in three layers
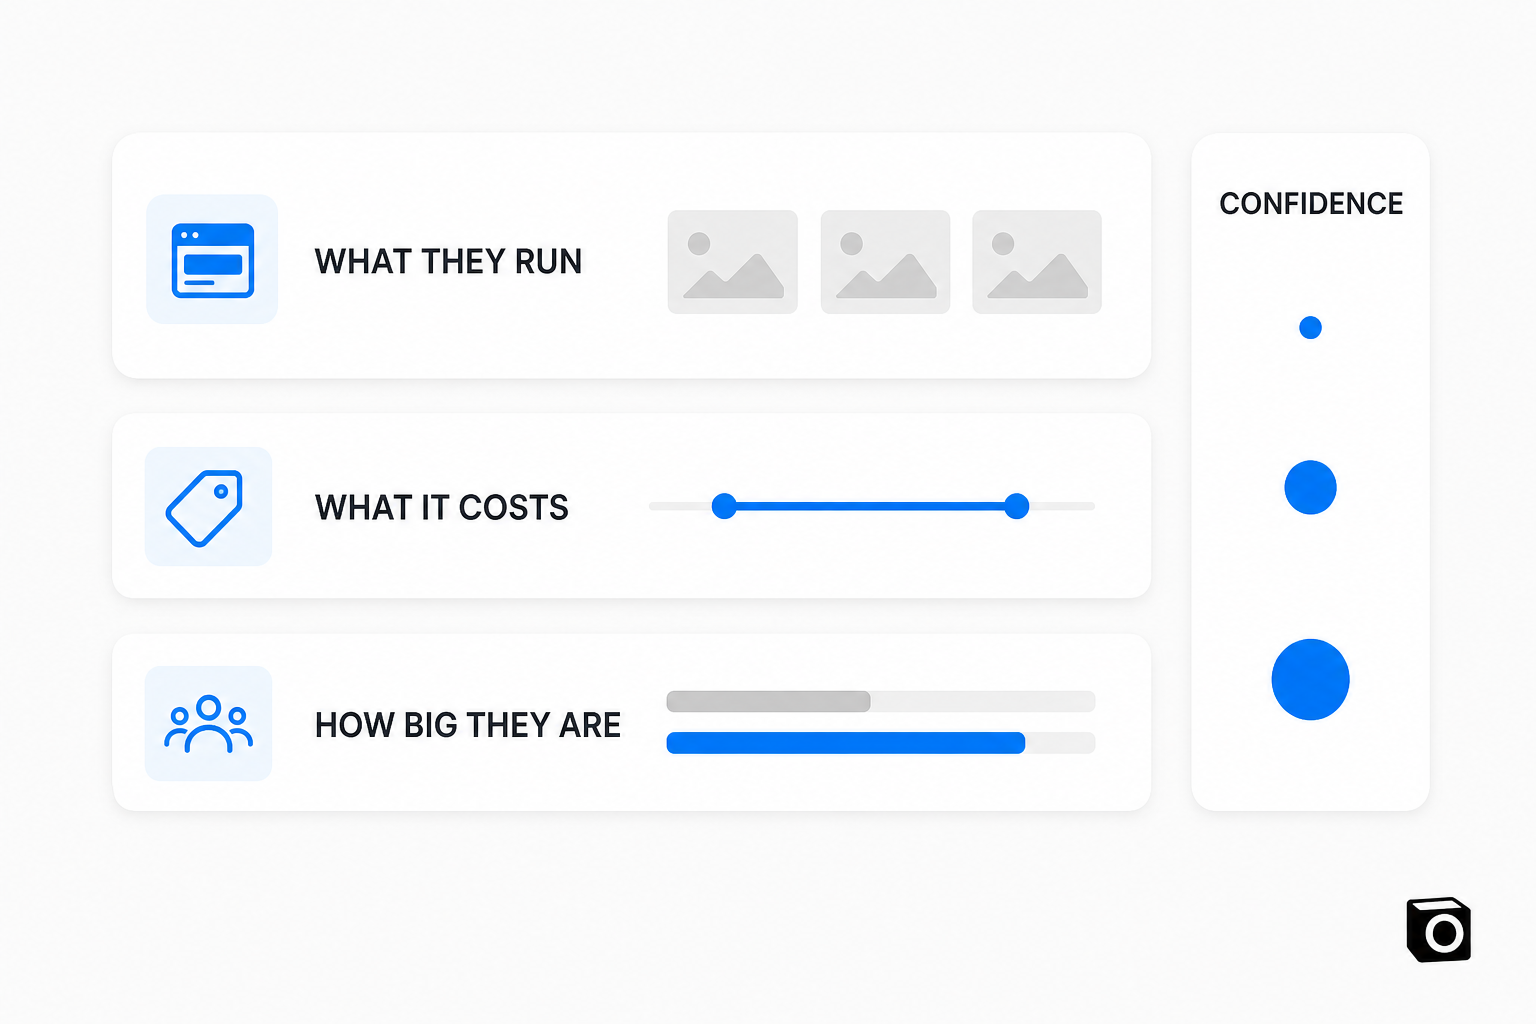
Each layer costs more effort than the last and gives you a tighter answer. Stop as soon as the answer is good enough to act on.
Layer 1: read the creative, not the budget
Pull every live ad from the libraries above and note one thing per ad: how long it has been running. An ad that has been live for six months is a winner they cannot afford to switch off. An ad that appeared last week is a test. Sort by longevity and you have their proven angles, ranked, for free.
I care more about this than about any dollar figure. A competitor running eleven near-identical variants of one hook is telling you that hook converts. One cycling through a new concept every fortnight is telling you nothing works yet.
Layer 2: turn keywords into a spend range
Now put a price on it. Pull the keywords they are clearly bidding on from their landing pages, then open Keyword Planner. Google defines its bid columns precisely: the top-of-page bid low range is "an approximation of the 20th percentile" and the high range "an approximation of the 80th percentile" of what advertisers have historically paid, alongside average monthly searches. Those two numbers are your floor and ceiling.
The arithmetic is deliberately crude. Say a keyword shows 12,000 average monthly searches and a top-of-page bid range of $4 to $11, and you apply your own account's click-through rate for a top slot — use yours, not an industry average, because yours is the one input you actually know. At a 6% rate that is 720 clicks a month, which lands between $2,880 and $7,920 on that single keyword. Repeat across their top ten terms and you have a monthly range, not a monthly number. Anyone who hands you a precise figure here is guessing with more confidence than the data supports.
Layer 3: let the auction tell you
This is the only method anchored to real money, and the real money is yours. If you already bid on the same keywords, the Auction Insights report gives you each competitor's impression share, which Google defines as "the number of impressions you received divided by the estimated number of impressions you were eligible to receive", plus overlap rate, position above rate and outranking share (column definitions here).
Scale from your own invoice. If you spend $4,000 a month on a keyword set at 18% impression share and a rival shows 54%, they are buying three times your impressions, so roughly $12,000 a month on that set — assuming comparable click-through rates and cost per click, which is exactly the assumption you should state out loud when you show the number to anyone else.
Free versus paid
Paid tools mostly sell you Layer 2 and Layer 3 pre-computed, plus display and social coverage you cannot get by hand. Semrush's Advertising Toolkit lists Base at $99/mo and Pro at $220/mo billed annually, and the four lines that page says Pro adds over Base are "AdClarity", "All competitor ads", "Display, video, or social ads" and "Competitor landing page views". The spend number sits inside AdClarity, which Semrush documents as analysing "expenditure, placement, buying methods, and more". Estimated, note: modelled from observed ad occurrences, not read off an invoice.
| Method | What you get | Cost | Confidence |
|---|---|---|---|
| Ad libraries | Creatives, run dates, formats, regions, EU targeting | Free | High on what they run, none on spend |
| Keyword Planner math | A spend range per keyword | Free with a Google Ads account | Order-of-magnitude |
| Auction Insights | Relative impression share against your own spend | Free, but needs live campaigns on the same terms | Highest available |
| Advertising toolkits | The above pre-computed, plus AdClarity's estimated ad spend for display, video and social | $99/mo Base, $220/mo Pro billed annually | Good for trend, still modelled |
My rule: if paid acquisition is your main channel, buy the tool, the hour it saves each week pays for it. If you are testing whether paid is even worth it, the three free layers get you to the same decision.
The step everyone skips
A competitor ad audit is worth almost nothing as a one-off. Its whole value is the delta: the ad that appeared this month, the one that quietly died, the geography that lit up. Everyone builds the spreadsheet once, feels informed, and never opens it again.
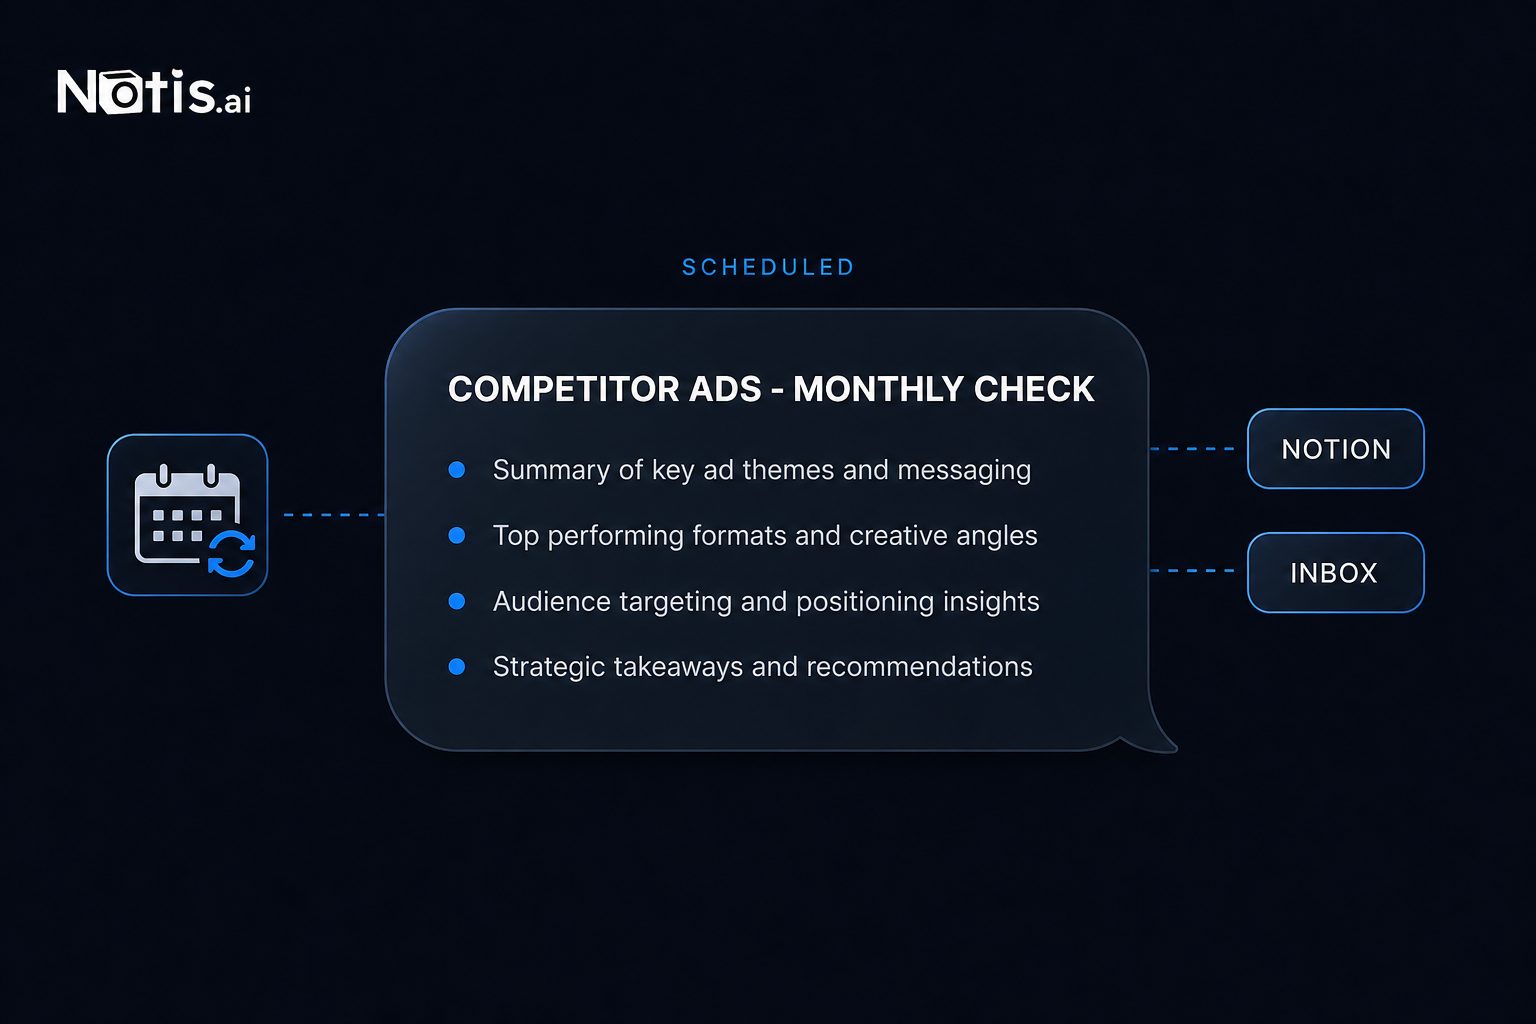
So I stopped doing it by hand. The check runs as a scheduled Notis automation: read the transparency pages for a named list of competitors, diff them against what was there last month, write the changed rows into a Notion database, and send me the summary in the chat thread I already live in. I never open the tool. It messages me.
The economics are the reason it stays on. Reading a web page through Notis costs about $0.004 on the on-demand catalogue, so a monthly sweep of a few dozen pages is cents, and that usage comes out of the allowance already included in the plan rather than being charged on top of it. The subscription is $13 a month billed annually. There is also a hard stop I rely on: any single pay-per-use call quoted above $1.20 is refused outright, and the agent has to tell me the price and ask before retrying, so a runaway scrape cannot happen while I sleep.
One detail matters more than the automation itself: it arrives as a message, in Notion and my inbox, where budget decisions actually get made. That is the whole difference between a monitoring system and a folder of dead spreadsheets.
What to do this week
- If you have never looked: spend an hour in the Ads Transparency Center and the Meta Ad Library on your three closest competitors, and rank their ads by run length. That list is your test backlog.
- If you already run paid: open Auction Insights first. It is free, it is anchored to your own spend, and it is the most accurate estimate you will ever get.
- If you are building a budget case: do the Keyword Planner arithmetic and present it as a range with the assumptions written down. A defensible range beats a precise fiction.
- Either way: schedule the re-run before you close the tab. The insight is in the delta, and the delta only exists if someone checks next month.
Competitor ad spend is a proxy. What you actually want is their conviction: which promises they are willing to keep paying for. The libraries hand you that for free, and it is on the record for a year or more. Go read it.

Based on an original idea from Flo. Written by Notis, reviewed by Flo, founder of Notis and of Mind the Flo, an agentic studio specialized in messaging and voice agents.
Related posts
How to Rank in ChatGPT: What Actually Gets You Cited
What actually gets a page cited in ChatGPT, from studies of 1.4M prompts and 26,283 cited URLs: index presence, the list format, and title match.
Can You Export Your ChatGPT Memory? The Honest Answer
The honest answer on exporting ChatGPT memory: what the export ZIP really contains, why memory stays behind, and the prompt workaround that half works.
Claude Code Agents and Subagents, Explained
How Claude Code agents and subagents really work, what the frontmatter fields do, and where those agents should actually run.