

How We Use PostHog to Measure Finished Work at Notis
How Notis uses PostHog for agent outcomes, errors, and feature flags—and why a tool call is not the same as finished work.
A tool call can succeed while the person who asked for help still gets nothing useful. That is an awkward foundation for an analytics dashboard.
At Notis, we use PostHog for product events, error tracking, and feature flags. The interesting part is deciding what those events mean. A person might ask an assistant to research something, prepare a document, and put it in the right place. Counting the first API request tells me very little about whether we finished the job.
This is how I think about PostHog for an AI product: start with the result the user can recognise, then work backwards to the signal that proves it happened. The chart comes later.
The product question comes before the event name
Notis accepts work through messages, voice, and a desktop or web app. It can use connected services, local tools, and a Cloud Computer. That gives us several places where an action can begin and several places where it can go wrong.
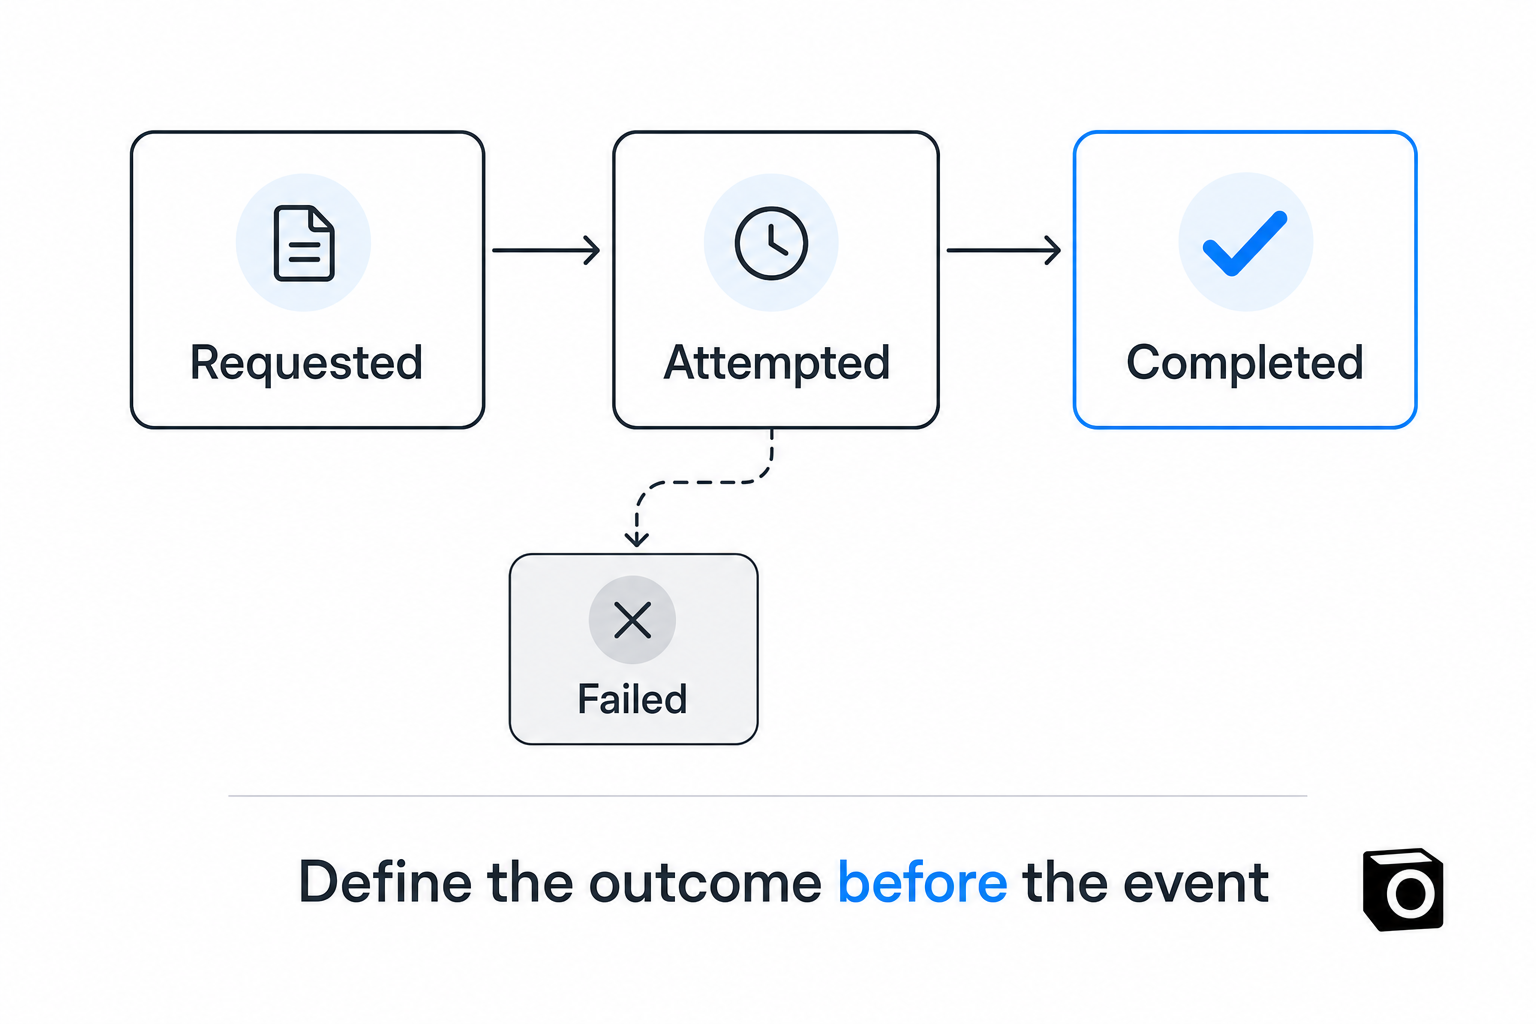
Consider a document request. The assistant accepts it. A tool runs. A response comes back. The document is saved. The user receives a link. These are related events, but they are not interchangeable.
My first question is what we are measuring. If it is tool execution, a successful tool response may be enough. If it is document creation, the saved document matters. If it is delivery, we need evidence from the delivery path. One cheerful event called “success” cannot answer all three.
PostHog’s product analytics documentation describes trends, funnels, retention, and paths built on captured events. That flexibility is useful. It also puts responsibility on us: a funnel built from vague events produces a very precise picture of something vaguely defined.
What our instrumentation actually records
Our backend integration supports event capture, exception reporting, and feature-flag evaluation. For newer product telemetry, our implementation contract places events at the end of an attempt and includes bounded descriptions of the surface, environment, and result.
“Bounded” is an unglamorous but useful word here. I want a small set of meaningful categories that can be compared over time. I do not want every variation of an assistant’s wording to become a new event property.
We keep configured state separate from observed behaviour. Knowing that somebody has connected an integration is different from knowing they successfully used it. Knowing they installed a skill is different from knowing the skill helped complete work.
That distinction changes the question I can ask. A configuration count helps explain what is available. A completed-use event helps explain what happened. Neither, on its own, tells me that a customer is happy.
Instrumented is not the same as measured
Here is a rule I want every founder building with agents to steal: code and a passing test prove that you have instrumented something. They do not prove that your production analytics contains the event you intended.
Our product analytics contract makes that separation explicit. A capability becomes measured only after an event from the deployed flow has been read back from production. Anything before that measurement boundary stays unknown.
This prevents a particularly tempting mistake: treating a blank chart as proof that nobody uses the feature. Perhaps nobody does. Perhaps the event never arrived. Perhaps the definition changed halfway through the reporting period. Those deserve different decisions.
For a new event, my practical checklist is straightforward:
- Define the exact action and the condition that counts as completion.
- Trigger that condition through the relevant product surface.
- Find the resulting event in production analytics.
- Check the result, environment, and time window.
- Record when the definition became trustworthy enough to report.
That is less exciting than announcing a new dashboard. It is also how the dashboard earns its place.
Retry logic belongs in the measurement design
Agent work can involve retries and delayed cleanup. If an analytics event is emitted again every time cleanup runs, the product starts looking more successful whenever its infrastructure gets less reliable. Lovely chart. Terrible conclusion.
For our pay-per-use tool telemetry, the implementation includes a durable event outbox. The tool result can be recorded first, and the analytics event can be dispatched from persisted state. Deduplication uses a derived identifier rather than handing the provider’s raw run reference to analytics.
The broader lesson is not that every product needs an elaborate outbox. It is that you need to decide whether you are counting attempts, results, or deliveries. Then design the retry behaviour around that choice.
I would rather have a small number of well-defined events than a sprawling taxonomy nobody trusts enough to use.
Keep the user’s work out of the chart
An AI assistant sees material that has no business becoming a convenient analytics dimension. Prompts, messages, document contents, commands, private URLs: these can all explain an individual interaction. That does not mean they belong in product analytics.
Our newer product-telemetry contract excludes that content and uses categories such as capability, surface, and outcome. This describes a specific instrumentation boundary; it is not a blanket claim about every historical event in our system.
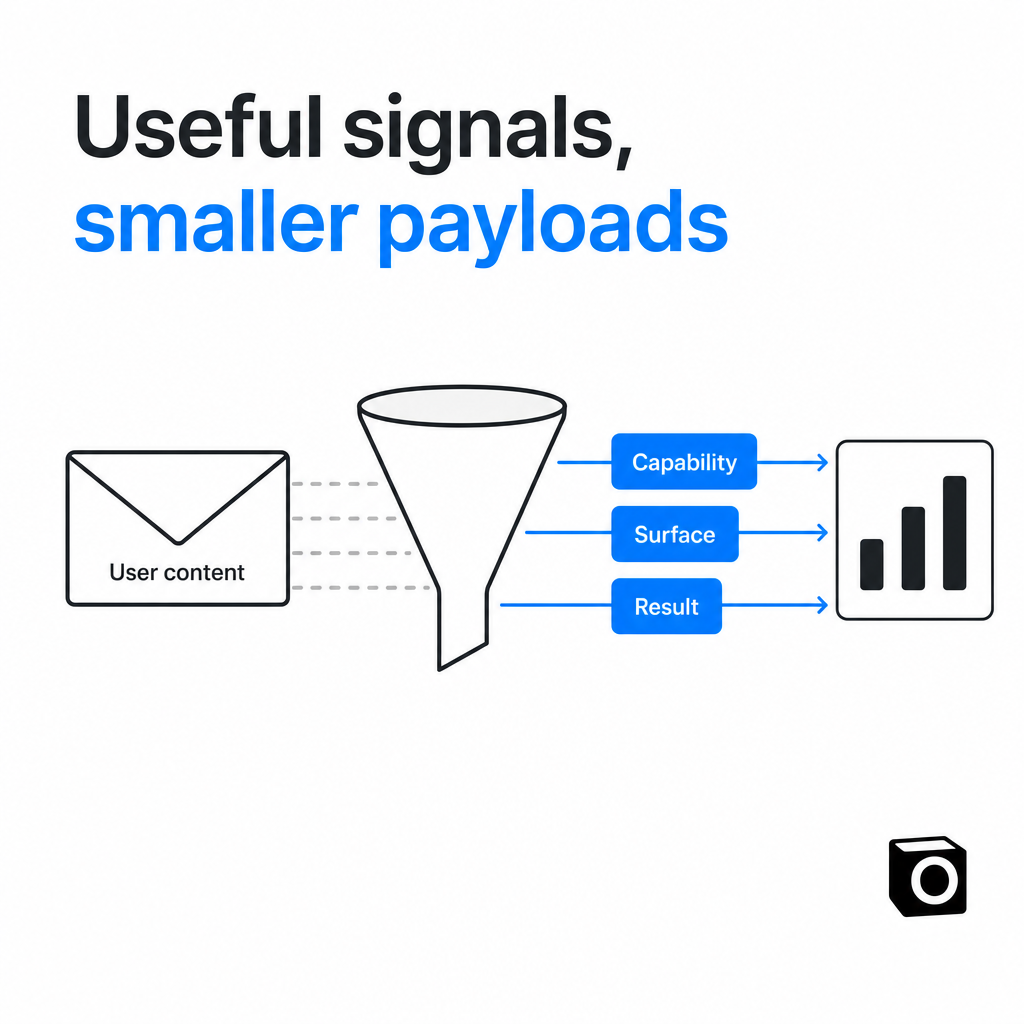
The question I ask while reviewing an event payload is simple: would this field change a product decision, or is it just interesting to have? If the answer is mostly curiosity, I want it out.
You can investigate a failure through the appropriate debugging workflow without turning an adoption report into a copy of the user’s workspace.
Feature flags and errors provide context
PostHog also sits in our feature-flag and error-tracking paths. That matters because an event count without context can be misleading. A capability may be available only on a particular surface or behind a rollout condition. A change in failures can make apparent adoption fall even if demand has not changed.
I would investigate those possibilities before rewriting onboarding because a chart dipped. The practical value is having behaviour, availability, and failures as questions I can examine together. It is not proof that any particular flag or dashboard improved retention.
Start with one decision you are willing to make
If you are instrumenting an AI product, pick a real decision: whether to improve document delivery, simplify integration setup, or investigate a failing workflow. Define the completed action that would inform it. Verify that action reaches your analytics. Only then expand the report.
That is the role PostHog plays in our stack. It gives us tools for inspecting behaviour; we still have to define behaviour honestly. My preferred first chart is the one where I can explain exactly what happened to make the line move.

Flo is the founder of Mind the Flo, an Agentic Studio specialized into messaging and voice agents.
Related posts
I Spoke to 400 Users. Analytics Still Couldn’t Tell Me What to Build.
What 400+ customer discovery conversations taught me about launching early, finding the real ICP, and using privacy-aware AI to turn raw feedback into product decisions.
The Week Notis Stopped Being a Science Project
Notis just hit profitability for the first time. Here’s what changed: better reliability, better retention, more referrals, and a clearer bet on UI-first agents over chat-first toys.
The Freelancer Betrayal: What Founders Forget About Incentives
I fired a freelancer after watching him promote competitors while working for us. The real lesson wasn’t drama. It was incentives, product intimacy, and the basic psychology of serving B2B clients.